Is the influence of humanity on the Earth’s climate worse than previously expected?
By Álvaro Escribano.
Based on research by Szabolcs Blazsek and Álvaro Escribano.
According to Intergovernmental Panel on Climate Change (2021), the Earth’s global surface temperature for 2081–2100 will very likely rise by 3.3 to 5.7 °C under the worst-case scenario, compared to the period of 1850–1900. This would imply dramatic consequences on nature and wildlife in terrestrial, wetland, and ocean ecosystems, and on humanity concerning food and water security, migration, health, higher risk of conflict worldwide, reduction of global economic product, and a possible collapse of the current societal organization. Climate change is partly caused by the influence of humanity, which started approximately 10–15 thousand years ago (Anthropocene), by commencing agricultural activities such as cultivating plants and livestock (Ruddiman 2005). That influence has significantly increased since the industrial revolution (1769–1840) when human activities such as burning fossil fuels (e.g., coal and oil) significantly increased. Since then, the influence of humans has grown further. The Earth’s population rose from 1 billion in 1800 to more than 7.8 billion in 2021, associated with a significant global-scale economic expansion. One of the consequences has been rising greenhouse gas emissions (e.g., carbon dioxide, CO2, nitrous oxide, N2O, methane, CH4), which are directly related to global warming. The atmospheric CO2 levels and land surface temperature are related to melting glaciers and sea ice.
Variables used in climate-econometric modeling
We name the climate–econometric models of those variables as ice-age models, as per the work of Castle and Hendry (2020) and Blazsek and Escribano (2022). During the 4.5 billion-year history of the Earth, the ice volume, atmospheric CO2, and land surface temperature changed, driven by exogenous orbital variables, such as (i) changes in the non-circularity of the Earth’s orbit with a period of 100 thousand years, (ii) changes in the tilt of the Earth’s rotational axis relative to the ecliptic (i.e., the plane of the Earth’s orbit around the Sun) with a period of 41 thousand years, and (iii) circular rotation of the rotational axis itself, which changes the season at which the Earth’s orbit is nearest to the Sun, with a period that is between 19 to 23 thousand years (it is variable due to the changes in the tilt of the rotational axis).
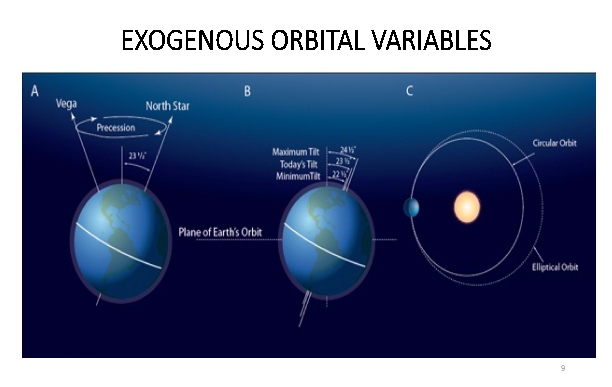
Figure 1: Description of the three orbital variables that influence the climate on earth
In our recent research, we have used data for climate and orbital variables for the last 798 thousand years. The climate variables in the model are global ice volume, atmospheric CO2, and Antarctic land surface temperature. The orbital variables (i) to (iii) are “exogenous” to humanity and are included in the ice-age models. Additional exogenous variables that may also influence the Earth’s climate are omitted, such as (iv) variations in the Sun’s radiation output, (v) volcanic eruption particles in the atmosphere and ice cover, and (vi) changes in the magnetic poles. The new ice-age models of the present paper consider error term specifications that allow for fat-tails and heteroskedasticity to control for the omitted variables (iv) to (vi).
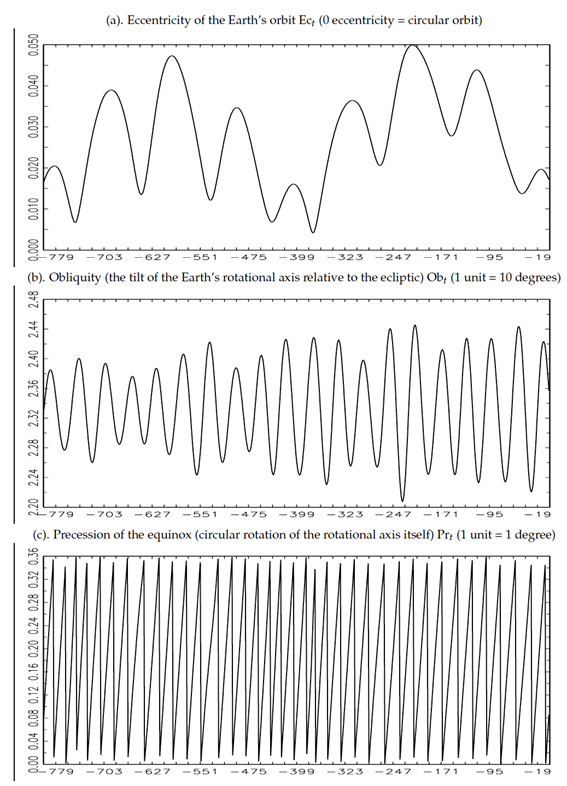
Figure 2: Evolution of the three orbital variables that influence the climate on earth in the last 800 thousand years. Notice the different cyclical behaviors observed in each orbital variable.
The dependent climate variables of this study are in Figure 3; global ice volume Icet, atmospheric CO2,t, and Antarctic land surface temperature Tempt, where t indicates the temporal evolution of the variables measuring 1000 years.
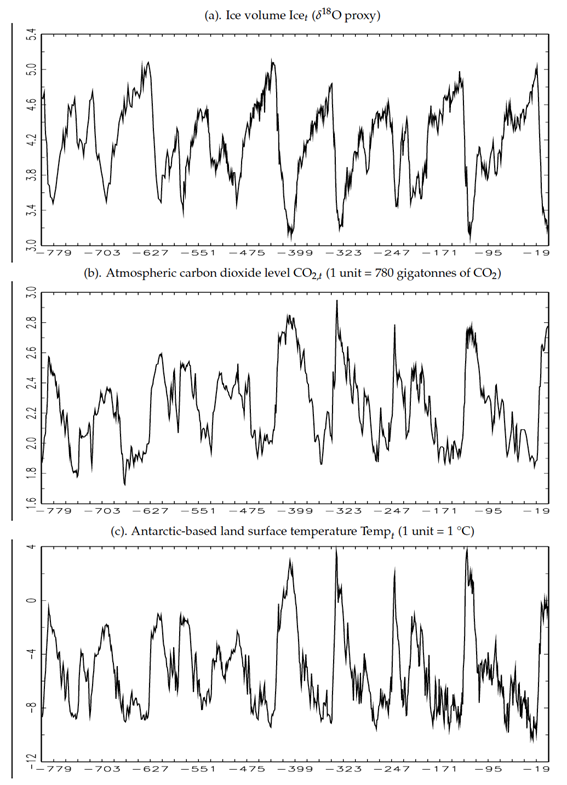
Figure 3: Evolution during the last 800 thousand years of ice volume, CO2, and Temperature, that jointly model to measure the climate change impact of human activity (Anthropocene). Notice the long cycles observed in the three series.
Blazsek and Escribano (2022) and Castle and Hendry (2020) provide details about the data they have used for the last 800 thousand years. In particular, the data source of global ice volume Ice is the time series of the 18O, obtained from calcium carbonate (CaCO3) shells of foraminifera, which are used to approximate temperature. Use benthic records of foraminifera from seafloor sediment collected at 57 globally distributed sites. Those sites are well-distributed in latitude, longitude, and depth in the Atlantic, Pacific, and Indian Oceans. The data source of atmospheric CO2 are past atmospheric CO2 concentrations determined by measuring the composition of air trapped in ice cores from Antarctica. Within the European Project for Ice Coring in Antarctica (EPICA), two deep ice cores have been drilled at Kohnen Station and Concordia Station (Dome C). The drillings were stopped at, or a few meters above, bedrock at a depth of 2774 m and 3270 m, respectively. The data source of Antarctic land surface temperature was obtained within the EPICA at the Concordia Station (Dome C), using deuterium Dice measurements from the surface down to 3259.7 m.
Long-run forecasting results of the impact of human activity on climate change
In Figure 4, the multi-step ahead out-of-sample forecasts of Icet, CO2,t, and Tempt for all ice-age models of this paper are presented following the results of Blazsek and Escribano (2022). Figure 4 includes the observed values of Icet, CO2,t, and Tempt, the forecasts of these variables, and the forecasts one standard deviation estimates of the forecasts. It shows the following results for the most recent period of the sample when humanity impacted the Earth’s climate. For the last 10-15 thousand years of the forecasting window, the observed values of global ice volume are below the forecast interval, indicating unexpectedly low levels of global ice volume. For the same period, the observed levels of CO2 and Antarctic land surface temperature are above the forecast interval, indicating unexpectedly high levels of CO2,t, and Antarctic land surface temperature.
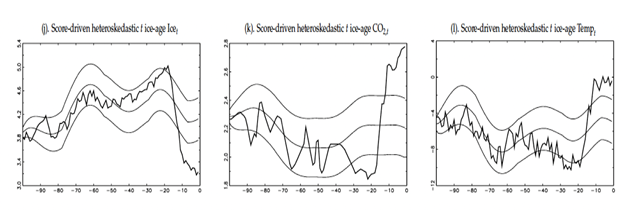
Figure 4: Multi-step ahead out-of-sample forecast of the last 100 thousand years for ice volume, CO2, and Temperature, with their confidence intervals. Notice that during the Anthropocene, the climate variables are outside their confidence intervals. Impact: Temperature and CO2 are higher than expected, and ice-volume is lower than expected during the Anthropocene.
Main conclusion
We have used data for climate and orbital variables for the last 798 thousand years and solved a dynamic misspecification of previous ice-age models. For the last 10 to 15 thousand years, when humanity influenced the Earth’s climate, we have found the following main results: (i) the forecasts of global ice volume are above the observed global ice volume, (ii) the forecasts of the atmospheric CO2 level are below the observed CO2 level, and (iii) the forecasts of Antarctic land surface temperature are below the observed Antarctic land surface temperature. These results may indicate the increasing influence of humanity on the Earth’s climate and provide a motivation to take further proactive actions to significantly reduce greenhouse gas emissions while responding to the most important challenge of the 21st century: global warming.
Further Reading:
Castle, Jennifer, and David F. Hendry. 2020. Climate econometrics: An overview. Foundations and Trends in Econometrics 10: 145–322.
Blazsek S. and A. Escribano (2022). “Robust estimation and forecasting of climate change using score-driven ice-age models”. Econometrics 10: 9, pages 1-29. https://doi.org/10.3390/econometrics10010009
Intergovernmental Panel on Climate Change. (2021). Sixth Assessment Report. Available online: https://www.ipcc.ch/report/ar6/wg1/#SPM.
Ruddiman, William. 2005. Plows, Plagues and Petroleum: How Humans Took Control of the Climate. Princeton: Princeton University Press.
About the authors:
Szabolcs Blazsek is Full Professor at the School of Business, Universidad Francisco Marroquín, Guatemala. He works in time series analysis of financial variables and on the econometrics of patents.
https://en.ufm.edu/catedratico/szabolcs-blazsek/
Álvaro Escribano is Full Professor in Economics at the Economics Department of the Universidad Carlos III de Madrid. He works in quantitative macroeconomics, financial econometrics, productivity, and patent analysis with firm-level data, and nonlinear time series models.
https://sites.google.com/view/uc3m-dpto-economia